RBSC-SubGen
※下部に日本語用に抜粋したHow to use?があります.目次からとぶことも可能です.
Purpose of this application
Provide RBSC-SubGen for users who want to solve subset selection problems.
(RBSC-SubGen is a type of subset selection problems solving method.)
Specifically, the web application allows to retrieve two subsets of one or two items that matches the desired RBSC coefficient.
Comparing two subsets with different properties will help you solve your problem.
Situations where RBSC-SubGen can be useful
- The construction of a representative subset allows processing in cases where there are not sufficient financial or computational resources to process all available data.
- Provide reliable results when the data is known to contain noise. (because one item selected at a time may not be the optimal solution).
- A posteriori analysis of subsets may yield better results than a posteriori analysis of a single solution.
How to use?
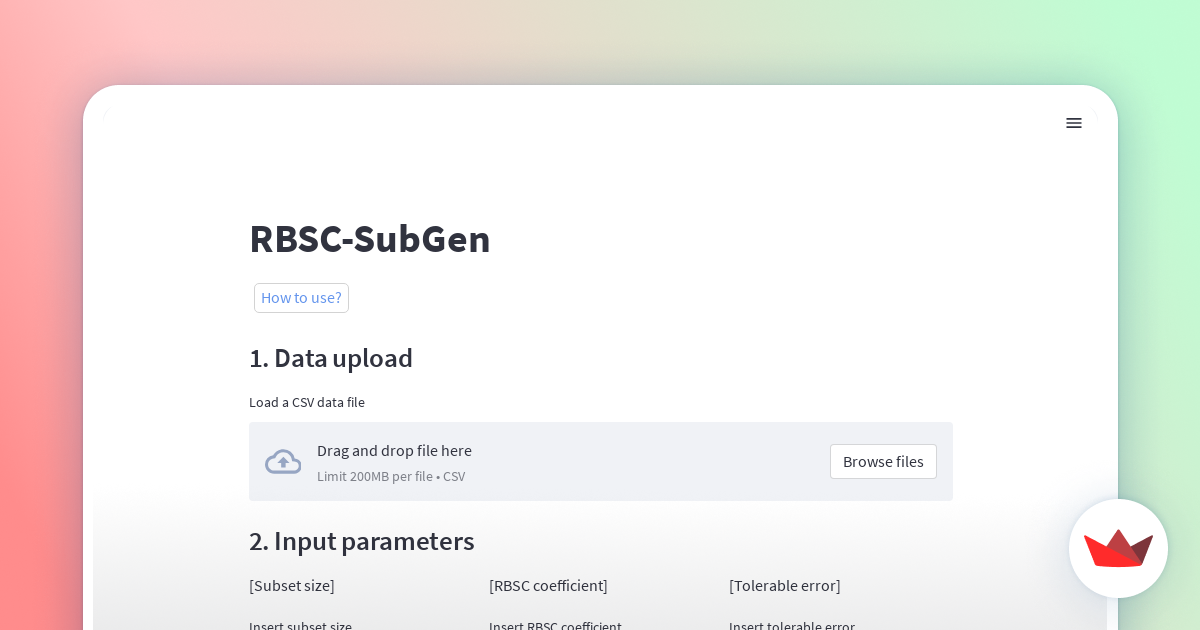
1. Data upload
Please upload the dataset to load a CSV data file.
Compatible file formats are CSV or dataframe.These values can have floating point precision.
After uploading a dataset, the contents of the dataset are displayed as a dataframe.
It then allows the selection of a reference column to extract two subsets from the universal set. You can select one or two columns.
Moreover, after uploading the data file, the size of the universal set is initialized automatically as the number of data points.
2. Input parameters
Please input directly into text fields.
- Subset size
Subset size is any positive integer and be less than the size of universal set. (If two columns are selected in 1. Data upload, the size of the subset must be less than 1/8 of the size of universal set.)
- RBSC coefficient
RBSC coefficients is a real number in the range [-1, 1].
- Tolerable error
Tolerable error is the tolerance between the desired RBSC coefficients and the actual calculated RBSC coefficients.
It is a real number in the range [0, 1].
3. Visualization parameters
Please input the number of histogram bins. This is a parameter that specifies the number of bins in the histogram of the distribution of the output subsets. This parameter is an arbitrary positive integer and must be greater than or equal to 1.
4. Run!
When you have completed steps 1 through 3, press the Run button. Processing will begin.
5. Outputs
- the histograms of the distributions of the data points (i.e. ranks) in the output subsets.
This gives an idea on how different the data points of the two subsets are.
This allows visualization of the degree to which the distribution of the output data elements differs.
The histogram can be downloaded as an PNG file.
- CSV file of the subsets
The datasets of the two subsets are displayed as data frames.
The subsets can be downloaded as a CSV file by pressing the Download data as CSV button.
- The actual value of the RBSC coefficient
It is calculated from the two generated subsets.
- Elapsed time
The processing time is reported as the time elapsed from the instant the Run button is pressed until the results are reported.
6. The maximum number of iteration
If you cannot create the expected subset, change Max. number of trials.
Confirming feasibility based on set sizes shows that there is a possibility of obtaining a solution, but it does not guarantee that a solution exists.
In order to avoid infinite loops, the maximum number of iteration is defined, over which the algorithm aborts.
By default, the maximum number of iteration is specified as 30.
For example
In this section, the usage flow of this web application will be explained using the diabetes dataset as an example. Let us assume that, when creating a new diabetes drug, we want to investigate how the characteristics of the subjects affect how the drug works and how effective the treatment is.
1. Data upload
First, upload the diabetes dataset to the Load a CSV data file in the Data upload field of the web application.
The contents of the dataset will then be displayed, allowing the selection of the columns on which to base the subset from the universal set. The number of elements in the whole set is automatically initialized from the number of elements in the data and displayed. The columns to be applied to the algorithm (i.e., subject characteristics) are selected here as BMI and Glucose. Although the BMI and Glucose features are used in this case, it is possible to generate a subset using other features instead of these features based on the application examples presented here. The application can also be extended to consider more features in order to generate subsets based on three or four features instead of only two.
2.Input parameters
The remaining input values are entered directly in the text field at 2.
Set each value as follows:
| Value name | Value to be set |
|---|---|
| Subset size | 25 |
| RBSC coefficient for BMI | 0.5 (to create two groups with no significant differences) |
| RBSC coefficient for Glucose | 0.75 (to create two groups with differences) |
| Tolerable error | 0.05 |
Here, the RBSC coefficient for BMI is set to 0.5 and the RBSC coefficient for Glucose to 0.75.
The RBSC coefficients take values from -1 to 1. The closer to 1, the more difference there is between the two subsets.
(That is, by generating two subsets that do not differ significantly in terms of BMI but have biased Glucose values, we can examine whether Glucose values make a difference in the efficacy of the drug.)
Therefore, we can expect the two generated subsets to be biased toward the lower or higher of the two for the Glucose item, although the BMI is not much different between the two.
3. Visualization parameter
Finally, enter the number of histogram bins representing the distribution of the elements of the subset to be output in 3. visualization parameter. In this case, the value is set to 10.
After all values have been entered, press the Run button to begin processing.
4. Outputs
After the algorithm has been successfully executed, the subset can be downloaded and certain information about the output and computational performance is reported.
First, the distribution of data elements in the output subset is displayed as a histogram. The graph shows the number of elements on the vertical axis and the value at which each element is distributed on the horizontal axis. This makes it possible to visualize how different the distributions of the output data elements are (i.e., how many elements in each of the two subsets have the same characteristics).
By comparing the two subsets generated in this way, it is possible to investigate how the effect of the drug varies for subjects with different characteristics.
In this example, two subject features, BMI and Glucose, were selected to generate a subset.
It is also possible to extend the method to generate subsets based on three or four features, not just two. Of course, it is also possible to select features other than BMI and Glucose.
FAQ
Where to save and delete your CSV data file and CSV file of the subsets?
1. Your CSV data
When you upload a CSV data file, the data are copied to the Streamlit backend via the browser, and contained in a BytesIO buffer in Python memory(i.e. RAM, not disk). The data will persist in RAM until the Streamlit app re-runs from top-to-bottom, which is on each widget interaction.
As files are stored in memory, they get deleted immediately as soon as they're not needed anyone.
This means the app removes a file from memory when:
- The user uploads another file, replacing the original one.
- The user clears the file uploader.
- The user closes the browser tab when they uploaded the file.

2. CSV file of the subsets
output.csv is stored in-memory while the user is connected, so it's a good idea to keep file sizes under a couple hundred megabytes to conserve memory.
Why does RBSC-SubGen return two subsets?
Originally, RBSC-SubGen was developed for the purpose of rating the difficulty of word collections (easy, hard), and was designed to return two subsets. In this case, the RBSC-SubGen returns two subsets because there is only one RBSC coefficient for each item.
Source code
The codes developed for the web application reported in this article are released in our repository.
The web application
Glossary
How to use?(日本語 ver.)
本Webアプリケーションの目的
部分集合選択問題を解決したいユーザ向けに,RBSC-SubGenを提供します.
(RBSC-SubGenは,部分集合選択問題の解法の一種です.)
具体的には,このWebアプリケーションにより所望するRBSC係数に基づいた2つの部分集合を取得することを可能にします.
異なる特性を持つ2つの部分集合を比較することで,みなさんの問題解決の手伝いになります.
RBSC-SubGenが役立つ場面
- 利用可能なすべてのデータを処理する際に十分な資金や計算資源がない場合においても,代表的な部分集合の構築によって処理を可能にします.
- データにノイズが含まれていることが分かっている場合に信頼性の高い結果を得ることができます(一度に選択した1つの項目が最適解とは限らないため).
- 部分集合の事後分析の方が単一の解についての事後分析よりも良い知見を得られる可能性があります.
具体例
糖尿病のデータセットを用いて例を示しながら本Webアプリケーションの使用の流れについて説明します. ここでは,「新たな糖尿病治療薬を作成する際,被験者の特徴によって薬の効き方や治療の効果にどのような影響があるか調べたい」と仮定します.
1. Data upload
まず糖尿病のデータセットをWebアプリケーションの1. Data upload欄のLoad a CSV data fileへアップロードします.ここで,互換性のあるファイル形式はデータフレームまたはCSVです.
(これらの値は浮動小数点数を持つことができます.)
すると,データセットの内容が表示され,全体集合から部分集合を取り分けるための基準とするカラムの選択が可能となります.カラムは1つまたは2つ選択できます.また,データの要素数から全体集合の要素数が自動的に初期化され表示されます. カラム(つまり,被験者の特徴)は,ここではBMIとGlucoseを選択します.
(今回はBMIやGlucoseの特徴を使用しますが,今回紹介する応用例を基にこれらの特徴の代わりに別の特徴を使用して部分集合を生成することも可能です.また,2つだけではなく3つ4つの特徴を基にした部分集合を生成するためにこの応用例を拡張してより多くの特徴を考慮することもできます.)
2. Input parameters
残りの入力値は2. Input parametersにて,テキストフィールドに直接入力します.
各要素の値は以下のように設定します.
| Value name | Value to be set |
|---|---|
| Subset size | 25 |
| RBSC coefficient for BMI | 0.5 (大きな違いのない2つのグループを作る) |
| RBSC coefficient for Glucose | 0.75 (違いがある2つのグループを作る) |
| Tolerable error | 0.05 |
ここで,BMIのRBSC係数を0.5,GulcoseのRBSC係数を0.75としました.
RBSC係数は-1から1の値をとりますが,1に近いほど2つの部分集合に差が生まれます.
そのため,生成される部分集合2つは,BMIは両者とも大差がありませんが,Glucoseの項目では両者どちらかが低い方か高い方に偏っている状態になると予想できます.(つまり,BMIについては大差がなく,Glucoseの値に偏りがある2つの部分集合を生成することで,Glucoseの値によって薬の効き目に違いがあるか調べることができます.)
3. Visualization parameter
最後に,3. Visualization parameterで出力する部分集合の要素の分布を表すヒストグラムのビンの数を入力します.自由に設定可能ですが,ここでは10とします.
すべての値の入力が完了したら,Runボタンを押すことで処理が始まります.
4. 出力結果
アルゴリズムの実行が正常に終了すると,部分集合のダウンロードが可能となり,出力・計算性能に関する特定の情報が報告されます.
出力される結果は以下の通りです.
- 部分集合のデータ要素の分布を示すヒストグラム
- 部分集合のデータフレーム
- 各項目のRBSC係数の実測値
- 処理時間
1と2の項目について順に説明していきます.
まず,出力された部分集合のデータ要素の分布はヒストグラムとして表示されます.グラフは縦軸が要素数,横軸が各要素が分布している値を示します.これにより,出力されたデータ要素の分布がどの程度異なるか(2つの部分集合がそれぞれどのような特徴を持つ要素が多いか)を可視化することが可能です.
ヒストグラムに続いて2つの部分集合のデータセットが表示されます.
なお,ヒストグラムとデータセットはそれぞれPNG,CSVファイルとしてダウンロードできます.
このようにして生成された2つの部分集合を比較・検討することで,特徴の異なる被験者によってそれぞれ薬の影響にどう変化があるのか調べることが可能となります.
Slide(スライド資料)
There are images of specific usage.
具体的な使用方法に関する画像があります.